
The decision to do nothing is still a decision…

My latest blog introduces a long-held area of personal interest and an emerging area of activity for our firm: that of assisting market-exposed clients establish frameworks that lead to more bankable performance compared with alternatives (including doing nothing).
In making the introduction I’m going to take the risk of leaning on the super-dry topic of decision-making under uncertainty in an attempt to explain how robust frameworks can promote higher-quality outcomes.
Along the way I’m going to unpack and focus on the question of hedging and the decision to ‘hedge’ (literally anything) in an effort to reinforce some key points.
Frameworks matter
Have you ever apprehended the arm-rest of a perfectly healthy airline seat while pretending not to be nervous in strong turbulence at 45,000 ft?
Let’s be honest: there’s no fun in being pitched around the ceiling, and you probably weren’t alone in choking that arm-rest. Some of your fellow passengers are likely to have suppressed an urge to scream; others are likely to have considered some futile assault on the cockpit door.
Don’t believe me? Try Googling ‘crazy reactions to strong turbulence.’
Aside from the fact that modern cockpits have sophisticated locking mechanisms, the good news is that your decision to do absolutely nothing turned out to be the best decision you could make.
Why?
Because decision-making frameworks with flight-controls and safety-protocols honed in various fields of science, backed by a hundred-plus years of controlled-flight data, were set by experts long before you bought your ticket. The risk of a modern jet-liner crashing from turbulence, even the heaviest most randomly experienced, is today so small it doesn’t register in International Civil Aviation Organization data.
Arm-rests aside, the modern air traveller has no need for turbulence-hedges.
Frameworks matter in finance (a lot)
Before I try and connect the quirks of aviation to the world of financial markets, ask yourself: would frameworks and protocols matter if instead of being crowded into an A-380 you were a passenger in a single-engine Cirrus SF50 Vision?
The answer is: they still matter. Size doesn’t make much difference when you’re dealing with gravity at 45,00 ft.
While the flight and safety protocols of the Cirrus may be different, the key point is that a framework is still crucial, perhaps even more so considering the 1,610kg SF50 has only one engine and no co-pilot.
Which brings me back to financial markets and the need for parties to be able to negotiate market turbulence: can the kind of lessons learned in distant fields like flight and engineering be turned profitably to use in financial markets?
My answer is a question: why not?
Operations Research has led us
Operations Research is the branch of knowledge that deals with methods to improve decision-making with an emphasis on advanced analytical methods. Why it is not so well known in financial circles is something of a mystery, but it is one of the key disciplines that have helped important fields make the world a better, typically safer place.
Consider this: the collected benefit of OR, from its earliest practical application in the desperate months of wartime Britain, to its influence on modern decision-making in healthcare, is hardly appreciated when it is even known to people in finance. Yet, like the opening-up of mass air-travel and the winning of wars, the potential value of better decision making in finance should not be underestimated.
While OR is not instantly recognisable it can be applied to almost any field (and typically already has), and some apply it without realising it, others are applying it haphazardly.
We are starting to simply apply it to add value.
Hedging as one example
My interest in financial markets was sparked by the realisation that portfolio management involved decision-making under uncertainty. The more important the decision, the greater the uncertainty; the more I liked it.
At various times my roles involved the tricky decision of whether to hedge certain elements of businesses that I ran or was involved in. This led me to think about how to apply OR and other tools to aid my decision making, I found that without a robust framework I was lost at sea, or to resubmit the aviation theme; I was mostly bouncing around in market turbulence without a parachute.
Imagine you’re an investment-manager running a partially-international investment portfolio, and let’s say the USD exposure of your portfolio averages 33% through time (which is a bit low compared to a recent well-regarded National Australia Bank survey).
Market-savvy, you’re likely to know a bunch of things already:
1. The 30-year annual calendar-year Hi-Lo range of the AUD/USD exchange rate is conservatively around 18% p.a., let’s stick with that,
2. Higher than average ranges occur approximately once every three years, and these average 31.1% (annual ranges) when they do occur.
Seated in the investment-manager role (it could just as easily be an import or export treasury role) you could infer some simple expectations based on the original market-neutral framework of Black-Scholes (ignoring logs, things are as likely to go up as down):
· Your USD-linked portfolio is impacted by higher-range years on average once every three years
· Average calendar years can be expected to result in moves of around 9% up or down
· High-range years can be expected to produce moves of 15.6% up or down
All of which is unremarkable; but consider these points from back-of-the-envelope calcs:
· At some point in your average year the USD-linked portfolio can reasonably be expected to either drag or enhance portfolio returns in the order of +/- 2.97%
· In a high-range year the drag or enhancement can be expected in the order of +/- 5.13%
The point to be made here is that the decision to hedge or not hedge exposure is consequential.
A separate but related point is that for those exposed to the Federal Government’s YFYS framework (Your Future Your Super) the hedging decision may be of heightened interest given that it takes YFYS managers further into a relative-performance arena.
That is: consequential decisions, whether well-formed or pot-luck, will be open to heightened scrutiny in a competitive sector that rarely produces net returns above 9% p.a. (7-year net p.a.).
So, what’s your framework?
Our experience has informed our approach, and that is to start by asking our clients some really simple questions, allowing them to self-test their current approach even if they never engage us:
1. Does uncertainty drive consequential outcomes?
2. If consequential, do you seek gain or protection from the exposure?
3. Do you have an existing framework to achieve what you seek?
And so forth….
What we all too occasionally find is that even where well-considered frameworks have been established the currency hedging-decision is often unloved, and often taken as a separate decision rather than a high-quality element of a high-quality investment management process.
To mention a few of the challenges we see firms not addressing well are:
· Some firms evidence framework-rigidity, others exceptional latitude (are we running a hedge fund?)
· Robust approaches to determining currency cheap/dear are often strewn across multiple spreadsheets owned by multiple decision-makers – i.e., the antithesis of a framework
· Tailored hedging product-suitability frameworks are often missing completely (premium illusion is real)
· Tests for correlation (natural hedges), regular or otherwise, are typically missing
· Stakeholder awareness is a problem (why did markets all rally 7% but we only made 3%?)
The last word
To leave you with a key message I’m going to turn to the words a professor of business history at Harvard Business School and Johns Hopkins University, Alfred D. Chandler Jr., who wrote that “unless structure follows strategy, inefficiency results”.
Mr Chandler’s theory is easy to quote, but what of the evidence it can work in investment management? As the Wall Street Journal recently found, Chandler’s approach has been found alive and well at a little-known US closed-end fund, Central Securities Corp, run by an even less well known manager: Wilmot H. Kidd III.
Wilmot H. Kidd III has racked up one of the greatest long-term track records in the history of investing.
Over the past 20 years, Mr. Kidd’s Central Securities Corp., a closed-end fund, has outperformed Warren Buffett’s Berkshire Hathaway Inc. Over the past 25, 30, 40 and even nearly 50 years under Mr. Kidd, Central Securities has resoundingly beaten the S&P 500.
Using Compounded Rates – A comparison of different methodologies in high volatility

My previous blog looked at the ways to use SOFR to calculate a term rate. Because SOFR is an overnight rate, users are obliged to transform this into a term rate such as 1-month to align with the settlement frequencies on financial products. This is typically done by averaging or compounding SOFR over the relevant period.
This blog looks at the impact of different methodologies during the periods of high SOFR volatility in 2008, 2019 and 2020. These dates were selected because they have large moves in SOFR over a short time frame resulting in significantly different outcomes for the compounded term rate. While this may be a relatively rare event, should we enter a period of increasing US overnight rates (Fed Funds) then this will be reflected in SOFR. Even minor differences in the methodology can lead to significant differences in outcomes.
Of course, you can set the SOFR rate upfront in the same way as LIBOR. This is Term SOFR and is available for licensing from CME. I will look at developments in Term SOFR in following blogs.
The term SOFR (small t) here is set in arrears once the final SOFR input is known.
A recap on the methodologies
I used this table in the previous blog to describe the basic methodologies used in creating a term SOFR.

In the previous blog I showed Lookback and Observation Period shift are quite similar in outcome for each hi.
In this blog I look at the Payment Delay and Lookback options only to show their relative performance in different conditions and for different lookback days.
2008 – the GFC effect
SOFR was not published until 2018 but the NY Fed has kindly provided a set of proxy SOFR rates derived from market inputs from much earlier dates including 2008. While this is not actually SOFR, it appears to be a good representation of the repo rates (SOFR proxy) from 1 August 2008 to 31 December 2008.
The following chart shows the rates over that period followed by 2 tables with the results for 17 September and 19 September 2008. I selected these 2 dates to demonstrate how a few days difference in the number of days for the lookback can give very different outcomes for the 1 and 3-month term rates.

SOFR was quite flat around 2.00% until 11 September 2008 (LHS red circle) when it spiked on 12 September and fell to 0.25% on 17 September. It then bounced to 1.82% on 19 September (RHS red circle) before continuing a volatile fall to near zero by 31 December 2008.
The grey shading for the 5-day lookback demonstrates how volatility can impact the outcomes for the methodologies.
Both the 1 and 3-month term SOFR rates differ because the input rates to the calculation are very volatile, and the difference of a few days can include or exclude outliers in the data set.
2019 – the SOFR spike in September
SOFR was setting at around 2% for most of September 2019 but spiked to 5.25% on 17 September on technical liquidity issues. While this was unusual it still had an impact on the outcomes for term SOFR rates which did or did not include the spike. The chart and table are below.

The payment delay does not include the spike but the lookbacks both have this feature in the data sets. This results in a 17-19 basis point increases in the 1-month term SOFR and 8-9 basis point increases in the 3 -month term SOFR.
Again, we see the impact of the choice of methodology on the outcomes for the term SOFR.
2020 – the COVID-19 impact in March
This period was quite volatile and presented 3 rapid falls in SOFR from 1.6% before 2 March 2020 to 0.00% by 18 March 2020. The red circle outlines the largest of these falls in SOFR between 13 and 16 March where SOFR moved from 1.20% to 0.26% over the weekend. The impacts are captured in the chart and table below.

Yet again, the methodology does matter. The 1-month difference between the payment lag (o days) and the 5-day lookback is almost 25 basis points! The 2 and 5-day lookbacks both include SOFR rates at 1.6% while the payment delay does not use that data. The outcomes are as expected with the lookbacks showing higher term SOFR rates than the payment delay.
Does this matter?
Last time we saw that the choice of methodology was not important when SOFR is not volatile: this has been the case in the recent past.
But the methodology does matter in periods when SOFR is volatile (2008), subject to a liquidity event (2019) or has a sudden change based on Fed activity (2020).
In these cases, we can see that the use of a 0, 2 or 5-day lookback can have very significant impacts on the term SOFR rate applied to a contract or trade.
Read the fine print carefully and align your hedges
Although the actual methodology does not significantly impact the term SOFR rate when markets are calm and the Fed is not moving the target band, this is not always the case. We have seen in this blog that a simple change of the lookback days can lead to important and meaningful differences in the final term SOFR.
So, as we stated in the previous blog, read the contractual terms very carefully, it does matter! And make sure you align the hedges as well.
Do you really want the risk of a mismatch in the timing of the SOFR data used for the calculation of the term SOFR? As we have seen, this can matter a great deal and can be eliminated by correct alignment of the hedge to the risk.
The next blog will look more at CME Term SOFR and how it performs relative to the compounded term SOFR.
Data may not lie, but it sure can conceal…
In our Insights blog from September, we explored the value of independence when considering a review of dealing desk performance, leveraging the events surrounding a well-known historical incident to make some hopefully valuable points. In this post I follow-up on the topic by sharing some insights into how a simplistic acceptance of a firm’s existing performance and/or risk data, justifiably derided as the ‘tick-and-flick approach’, can lead to downstream problems.

Spot the elephant
Lee Baker
Lee Baker is an accomplished data scientist, software creator, CEO of ChiSquared Innovations, and author of at least fourteen books on how to work with data. His almost perfectly-named firm has a vision to “produce statistical analysis systems that take you ‘from data to story’ with as little fuss as possible.”
I was drawn to Lee’s earliest work in 2017 when his hit, Truth, Lies & Statistics: How to Lie with Statistics seemed to confirm a former boss’s suspicion that when Powerpoint was used in business the content was nine-tenths deception. But Baker’s clever rearrangement of a quote often attributed to Mark Twain was also catchy; though Twain borrowed from Benjamin Disraeli who is reputed to have remarked that: “There are three kinds of lies: lies, damned lies, and statistics.”
Truth, Lies & Statistics is an easy and fun read, and with chapters like “Pirates Caused Global Warming” (debunking the Post Hoc fallacy) it’s like a crib book for the statistically devious. But while Twain and Disraeli risked painting actual statisticians in a bad light, Baker mounts a partly-convincing defence, turning his sights on those who might use statistical tricks to “hoodwink and otherwise dupe the unwary.”
What Baker’s works reveal is that there are lots of ways data can be manipulated or misrepresented for gain or deception.
The data challenge
In modern finance the average firm produces quite staggering amounts of data, and there are many ways it is ‘manipulated’ for good or not-so-good, but with the rather obvious rider that it is overwhelmingly intended to be for good. For those faced with the daily consumption of Fantasia-inspired bucketloads of information it can be useful to ask if you truly understand what the information is telling you? But we also suggest you ask: what is it not telling you?
At Martialis, our view is that practically none of the data ‘manipulations’ used to create 1st and 2nd line reporting were ever devised to “dupe the unwary” as Lee Baker put it. In truth, they’re purpose-built, specifically designed to guide and inform, and firms spend millions trying to ensure this. Despite this, our experience has shown that even the most perfectly presented reporting, containing data of the highest quality (clean), can still dupe both the wary and the unwary, and this can create problems if left unchecked.
What has led us to this seemingly contentious conclusion?
It would be easy to answer this by simply reminding readers that humans are fallible, but there are often deep-seated reasons why data can cause problems, which we broadly catalogue as:
Complacency, inertia and variability of experience;
Misinterpretations, and/or misunderstandings;
Misadventure, not exactly “the dog ate my report,” but variants that might surprise, including reporting-line and staffing changes, particularly of management;
Information overload, a not uncommon problem in a heavily regulated industry; and
Lack of reporting completeness and/or modernity.
And it’s this last category that I will expand on today: the lack of completeness and/or modernity in the 3rd-line space, drawing on recent work with clients and the directions we have been taking in our Dealing Desk Review practice.
Lessons from 2004
In my September blog-post I referred to a difficult moment in 2004-finance that shocked dealing desks across Australia and elsewhere (and upon which information can be readily found with any search-engine). What we know from the incident is that dealing staff sought and found ways to conceal unauthorised activity. We also know that senior dealing management’s interest in the underlying activities of the desk proved insufficient, and there were elements of complacency, misinterpretation of data, and some information-overload thrown in for good measure (regulators did eventually note some 800 individual limit breaches had been concealed; so, data was likely piling up somewhere).
However, and this is key; the reporting at the firm which suffered the eventual loss did not produce red-flags of sufficient magnitude at high-enough points on the management-hierarchy to back-up those brave risk management professionals who did alert management to a suspected desk-out-of-control problem.
At this point I will re-emphasise the point I made in my September blog: an independent review of the flags that were being raised in 2003 and ‘04 would likely have saved millions.
Bigger lessons still
Through relatively simple research, we found that since Y2k there have been at least 47 dealing-desk losses of greater than US$100m magnitude, including the Australian loss of our blog. What’s striking is that a clear majority of these were experienced by well-regarded and major global financials.
Of these:
Total losses (of the 47) amounted to U$101.6B at mid-2021 values,.
The largest amounted to U$11.4 billion (2008).
A great many more (that we couldn’t research) comprised losses of less than US$100 million.
Of losses (by the amount lost):
o 78.7% were generated by firms that had a Big-4 audit relationship;
o 39.3% were generated by a Systematically Important Bank; and
o 10.4% involved non-linear derivative products (somewhat surprisingly)
Not all involved fraudulent dealing activity.
Which has, at least in part, encouraged us to expand on the client-driven demand for Martials approach to data-analysis completed in prior years in this specialist field.
What can we deploy (now)
Having commenced desk reviews in 2019, we have steadily grown the areas of this interesting capability, with focus on three broad fields:
1. Discovery – developing a proprietary base-line view of the desk on which the need for deeper review can be determined:
a. Type of desk
b. Unusual or atypical attributes – returns/risk/other
c. Peculiarities versus norms/peers
2. Desk Conformity, with/to:
a. The implied or present regulatory environment
b. Industry standards
c. Market best-practice
d. Policy
3. Desk Alignment, with/to:
a. Strategic intent, e.g., sources of revenue and/or risk, type of desk
b. Adjacent businesses, as stand-alone or as a component with
c. The degree of complementarity
Answering interesting questions
Does the desk generate actual outcomes consistent with its mandate and stated strategy?
Does the desk demonstrate sustainability from a range of Martialis proprietary standpoints?
Are there elements of performance/risk/funding that warrant deeper review?
In generating revenue, is the desk conforming with regulatory and industry standards and expectations?
Does the activity entail supervisory corner-cutting, individual or entity overreliance, or elements of questionable activity?
In the process, we catalogue and flag areas where a desk may be adrift from industry best-practice standards and methods. Our focus is on the alignment to your strategy and how this compares with similar desks at other firms.
We look at the performance over a number of years and your assumptions of revenue sources against the actual revenue in the Discovery phase. Our experience suggests assumptions and performances are often poorly correlated and a detailed investigation can improve business performance.
Using Compounded Overnight Rates – a basic guide
As markets move towards overnight rates and away from LIBOR (and other IBORs) there are a variety of ways to transform theses rates into a simple interest rate that can be used for the relevant period, say 1-month. My previous blog on the alternatives for term rates in USD looked at how these could be used to replace LIBOR.
This blog addresses the ways in which the overnight rates can be turned into a rate which is applied for a period such as 1-month (or 3, 6 etc. months). and how these are accessed in the USD SOFR market example.
As many have noted previously, when you use overnight rates to calculate a ‘term’ rate (i.e. one for that period) the actual result is not known until the end of each relevant period. The final rate is not published until the day following the final rate fix and many firms need a number of days to arrange for calculation and payment resulting in a variety of methodologies to accommodate this ‘inconvenience’.
Note that the term rate is not a Term rate such as Term SOFR. A Term rate is set at the start of the period whereas the term rate is not known until the end of the period. The terminology is a little confusing but it is commonly used.

Some basic concepts
Using SOFR as an example, the basic compounding and averaging calculations for each period are:

Some common methods for allowing for payments to be arranged
As mentioned above, the final SOFR rate is not known until the day after it is set and many firms need a few days to arrange for payments. The more common variants are payment delays, lookbacks (observation shifts or ‘lag’) and observation period shifts (‘shift’).
Each variant is in current use and often one is favoured for a particular product.

The difference between the lookback and the observation period shift is important.
A lookback preserves the relevant period and simply uses the ri from a certain number of days prior. This can have the disadvantage that the ri intended for a particular number of days may not be applied to that number in the calculation. This is the main reason a 5-day lookback is often favoured because it has a better chance of alignment than a 2-day lookback.
The observation period shift avoids this problem by moving the whole calculation back a number of days thereby ensuring the ri continue to align with the correct days.
NY Fed SOFR, SOFR Averages and Index publication
The NY Fed publish the Daily SOFR and a number of other calculations each day at 0800 ET. These are excerpts of the screens.
The SOFR rate (0.05%) is per day in the first screen and the 30, 90 and 180-day averages plus the index is also provided.
The ‘Average’ is actually the simple interest rate calculated using the compounding methodology but is referred to as the average. This can be confusing but it is accepted by markets.
The index is the discount factor calculated each day using the SOFR rates and measures the cumulative value since 2 April 2018. The index can be used for the observation period shift methodology by finding the dates and using the formula below. Note the index cannot be used for a lookback because the dates are no longer aligned to the appropriate SOFR rates.
The following tables are snapshots of the NY Fed pages for SOFR and then the Averages and Index.


Does this matter?
The simple answer is ‘not at this time and with these rates’.
In this table I have used 8 decimal places to show there is little difference in the rates. Most product and contracts round to 5 decimal places so there would be no difference. But be aware that the NY Fed Averages are actually the compounded 90-day and do differ from the more commonly used 3-month period.

It is also worth noting that the compounded and averaged calculations of the rate are different.
Read the fine print
It is clearly important to know if the methodology is compounded or averaged because this will almost always lead to different rates. Both calculations are used in USD products.
Likewise, it is important to use the correct dates: 90-day or 3-month as this also matters to the final rate.
So, read the contractual terms very carefully, it does matter!
The next blog will look more into how the methodologies can impact the rates when rates are SOFR higher and/or have greater volatility. In these cases, the choice of lookback or observation period shift can matter.
Lessons on the road to cessation – the JPY capital markets

In our last post we resorted to a smorgasbord metaphor to help carry the point that in the post-LIBOR world market participants have so many alternate benchmarks they should carefully evaluate for choice. Given some of the feedback, we thought it worth following up with a close look at progress in Japan. It’s a jurisdiction with a massive savings pool where benchmark choices appear somewhat different to USD and GBP.
What we found was more than interesting.
The USD market – real progress since 2019
On July 31st 2019, the world’s first SOFR deal settled; JP Morgan was issuing another piece of its regular preferred stock offerings. As Risk.Net sagely noted at the time, the issue had a “first-of-its-kind provision buried in the small print.” What they were pointing to was that the floating leg would “pay a forward-looking term rate based on SOFR, the secured overnight financing rate.” The $2.25 billion deal was set to pay a fixed-coupon of 5% through to August 1, 2024 thereafter switching to “a floating rate of three-month term SOFR, plus a spread of 3.38%.”
Which was quite brave of JP Morgan; term-SOFR had not yet hurdled regulatory approval let alone seen the light of day, and there could have been no certainty regarding the future viability of Term-SOFR.
Today, USD issuance in a SOFR format is more common than LIBOR, so much so that the CME run a SOFR Issuance Tracker, offer a wide suite of futures, and OTC market-makers have followed the obvious trend. Market conventions appear to have largely settled.
Looking into issuance data, what we note is that the hallmarks of a successful USD product transition are falling into place. Likewise, UK markets have carried-off a similar transition to their SONIA-based future, with markets now almost entirely absent GBP-LIBOR dealings. Thus, the crucial USD and GBP-based capital and financial markets appear to have the necessary features that promote their proper functioning:
For the sake of building up a point of comparison from which to judge the ARR scene in Japan, we review USD issuance since mid-2019.

Which to us is an impressive backdrop.
The Yen market – limited progress
In our comparative look at Japanese markets, we asked a simple question; what’s been happening in the market for JPY alternate reference rates (ARRs)?
Here is what we found for the same period (Mid-2019 onwards):

The Bank of Japan’s Cross-Industry Committee on Japanese Yen Interest Rate Benchmarks was established in August, 2018, and in November 2019, Quick Corporation’s forward-looking TORF benchmark was announced as the rate “most supported by public consultations.” The availability of an OIS-based TORF (in production since April 26th 2021) offers market participants a Japanese Term-SONIA lookalike in most respects, and it should be operationally easier than compounded alternates.
And JPY issuers have a range of other choices they can tap:
TIBOR, the Japanese Bankers Association administered rate, has been calculated and published as "Japanese Yen TIBOR" since November 1995 and is NOT scheduled to cease when JPY-LIBOR does.
Compound or Simple Interest TONA, could be thought of as Japan’s version of SONIA (unsecured, unlike SOFR), the modern form of TONA was introduced in 2016 and is administered and published by the Bank of Japan.
Digging a little further, we found that the single instance of TONA use in issuance was actually deferred until September 2026, coming as it does in the form of a convertible security issued by Mitsubishi Corporation:
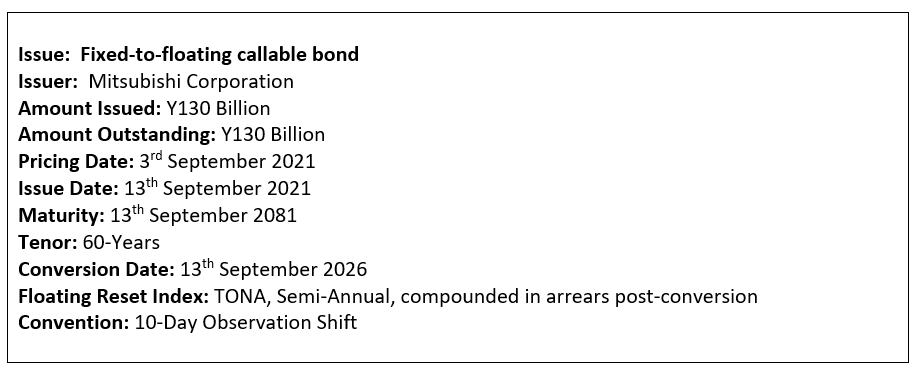
What this points to is that notwithstanding the Mitsubishi callable (which we note could be called before it ever converts), there is currently not a single floating issue referencing compound or simple TONA, and none referencing TORF whatsoever (further queries on this with major data providers confirmed that there have been no TORF security issues).
We will follow-up this analysis with a look at JPY-based corporate and syndicated facilities in coming posts.
Digging still further we took a deeper look at historic behaviour of the various choices, and noted that the annual volatility (a favourite measure, expressed in basis-points of underlying yield) of different ARR’s, including those where a particular convention might be used can be vastly different.
Consider the following distinctive range of volatilities over the past 10 years data:

JPY-LIBOR is clearly the most volatile, which is not unreasonable given LIBORs credit sensitivity, whereas TONA variants and TORF do not. But this opens the question of: why does TIBOR not travel at a similar volatility to JPY-LIBOR? And looking across time, why has TIBOR remained where it is despite the collapse in JPY-LIBOR and TONA to negative rates?
This suggests that those looking to Japan’s capital markets need to tread carefully around benchmark liquidity as well as expected benchmark performance, and those offering JPY drawings have to be able to find appropriate points of funding.
Are Japanese institutional features at play here?
To help us answer the question of why JPY markets have largely ignored the development of ARR’s we turned to macro-economic texts and some research on the features of Japanese finance.
These indicate that there are a range of features at play:
Existing Bank of Japan interest rate settings continue to compress short-dated JPY yields, e.g., the JPY OIS Curve is negative to 4-Years, 9-Months
Forward yield projections are partially implied by the extent to which the Bank of Japan is expected to hit its “Price Stability Target” of 2% at a time when Japanese Core Consumer Prices have been negative for all but one of the past twelve months
The size of the household saving ratio in Japan (estimated at 11.4% percent for 2020) is the highest since 1994, adding to the existing Japanese savings pool
To the extent that Japanese Corporations require funds there is a long-run preponderance of bank funding over bond funding
To gain a stronger feel for whether these features are right we turned to a Japanese based interest-rate dealer, Stuart Giles a Japan-based interest rate dealer
RB – Stuart, you’ve traded Japanese markets and rates for an extended period, can you give us a feel for why Japanese floating-rate issuance is exceptionally low?
SG – Traditionally there’s been an over reliance on bank funding vs domestic market issuance, but this has changed marginally in the Covid-19 era. Demand for floating-rate paper remains low as it provides yield starved local investors little in terms of carry or potential for capital gain. With essentially no prospect of higher floating rates here I don’t expect this to change. Floating-rate issuance also serves no practical purpose for hedging ALM mismatches
RB – Can you see the TORF benchmark developing momentum and liquidity in the manner of say Term-SONIA or SOFR?
SG – With the recent pickup in liquidity in TONA, this increases the robustness of the TORF benchmark given that TORF is based on the uncollateralized overnight call rate. There are still some important issues with the use of TORF to be addressed such as the establishment of the governance structure and an improvement of transparency in the calculation process however.
RB – If you had to guess, what would be the prominent Japanese benchmark in 10-20 years’ time from now?
SG – A further shift away from TIBOR may require additional pressure from regulators, so near term I’d expect it remains the dominant reference rate. The momentum is clear however that risk-free reference rates are the global norm, and Japan will likely keep moving in this direction also. TORF is well designed with advance fixing and thus predictability of cash flow like Tibor/Libor fixings. Once we have the availability of cleared TORF products I think this benchmark can become the dominant reference point for markets.
Lessons
Our main take-away from these surprising JPY findings is that big assumptions can be quite dangerous. The Japanese economy and it’s institutional features and pressures have all ‘conspired’ to ensure that Japan’s capital markets are different to GBP and USD, and other currencies, and thus the path to JPY-LIBOR’s cessation is quite distinctive.
For those considering tapping one of the world’s largest savings pools the lesson here is that it will pay to fully understand the range of factors that drive your outcome; which is likely to rest in the fundamental nature of the underlying benchmark.
It really is a Smor Gås Bord…The decision on which post-LIBOR benchmark to use
In this blog we explore the increasing degrees of product-freedom available across post-LIBOR financial markets and the corporate finance suite. With the dizzying array of options seemingly available, we pose important questions for market participants to consider.

It’s not quite A Table Alphabeticall, and, somewhat amazingly, the Cambridge dictionary has only been available on-line since 1998, but they helpfully define the original Swedish noun ‘Smorgasbord’ as: a mixture of many different hot and cold dishes that are arranged so that you can serve yourself.
Why on earth is this relevant in 2021 finance? Well, we’ve come to the conclusion that the Swede’s mix of smor (butter), gås (goose), and bord (table) is the near-perfect metaphor for the world of post-LIBOR finance.
We field a lot of finance questions from many different clients, and increasingly note that there is a wide and increasing array of ways to contract new deals. All of these have quite different ‘gives versus gets,’ and component pieces. Some are refined, some are quite raw and participants appear to have to figure out how to serve themselves.
And it may be difficult for bankers to accurately describe what’s on all those platters.
It’s now over four years since Andrew Bailey gave his momentous ‘The future of LIBOR’ speech. Despite the opportunity that many of us expected that LIBOR reform would bend market conventions toward conformity, the lived reform experience has been of the market response leading us to a world of far greater complexity.
Corporate finance and financial markets products are not going to click together with the simple LEGO-like efficiency of LIBOR products: new benchmarks are really quite different. Not just a little different; a lot different (think volatility).
So, what kind of basic questions should one consider when approaching the post-LIBOR deal ‘bord’?
Do I really understand the underlying nature of the Alternative Reference Rate (ARR) I’m about to reference and use in contracts?
How have ARR’s, or proxies, performed in terms of realised outcomes, annual ranges and historical volatility?
What do ARR’s actually do at times of market disruption and heightened market volatility?
Am I willing to accept the credit sensitivity of the financial sector remaining at play in my all-in cost outcome? The credit sensitivity is a feature of LIBOR and ARRs such as BSBY, Ameribor, CRITR and AXI.
Could there be an all-in-rate advantage to accepting credit sensitivity?
s the choice of ARR different for a borrower or investors?
Then, excuse fingers, there are real questions about what type of cutlery is available to help consume all these trimmings?
Term RFR’s seem like a viable solution, but can I access them if regulators impose use-case limits?
If I go term rate (credit sensitive or RFR) and need a derivative hedge, am I sure I can get one?
If I get a hedge, will it work like traditional LIBOR hedges did in all cases?
Speaking of that hedge, what about in three- or five-years’ time if use-case limits change and liquidity dries up?
Cross currency swaps are two-day lagged, my cash instrument is five-day lookback, how am I (and my auditor) going to handle the exposure to basis risk and short-term liquidity?
Can I get a convention match?
We’re not sure what part of the smorgasbord metaphor we can use for the other important considerations, but perhaps these are best described as condiments?
My bankers insist on imposing an interest rate floor, isn’t that now at-the-money?
Shouldn’t that floor also be embedded in the hedge?
What’s this difference between period-floors and daily floors in the RFR facility, and why does it matter?
Bloomberg Index Services Limited rates show some large differences in credit-adjustment-spreads between currencies and tenors in the ISDA fallback conventions, but my bankers want a one-size fits all margin in my multi-currency facility. What the gives here?
To gain a better sense for the practical realities we spoke on this topic with Managing Associate, Yu Zhang, a specialist in the banking at corporate finance practice at leading legal firm, Allens Linklaters in Sydney.
“I think the smorgasbord analogy is quite apt.
The range of possible ARR/RFR conventions is somewhat daunting, then there’s the choice between credit-sensitive and essentially credit-risk free rates, and we think clients need to evaluate each of those areas very carefully. Then, for corporate finance and securities issuance, there are a range of risk-free-rate contractual facets that need to be considered, also carefully given the way these can influence economic outcomes.
Whereas a standard LIBOR corporate facility of old might contain three or four contractually meaningful elements (i.e., that can impact economic outcomes), when we deal with RFR-based deals, there are a lot more.
People should pick their meal from this smorgasbord carefully, and I think that view, that caution, is generally better understood than it was only a few months ago.”
Yu Zhang, Allens Linklaters
What’s dawning on market participants is this: if you attempt major global cross-jurisdictional reforms and invite market regulators, the sell-side and the buy-side, and the loan-markets and derivative markets industry bodies to the same dinner party, not everyone wants a Big Mac.
Which is a recipe for confusion.
For those charged with determining efficient capital costs or maximising returns we think it will be important to be able to cut through the confusion, and soon.
And lastly, try to avoid being the Gås!
Synthetic LIBOR - More devils in the detail?
Counterintuitively, the suite of LIBOR regulatory reform measures has often served to actually stoke market confusion. Judging from client reactions, the FCA’s latest consultation adds to the list of measures in the ‘confusing’ category. In this blog we explore the CP21/29 consultation, place it in its proper context, explain what may be causing the confusing, and work on demystifying it. All is not as it seems!

FCA CP21/29
On 29th September the UK’s FCA issued a number of important market notices, which included a seemingly innocuous consultation paper CP21/29, Proposed decisions on the use of LIBOR (Articles 23C and 21A BMR).
CP21/29 follows on from previous, related consultations:
§ CP 21/15 of May 2021, on the FCA use of critical benchmark powers, and
§ CP 21/19 of June 2021, on GBP and YEN LIBOR settings.
The key to understanding CP21/29 is that it pertains to two quite specific areas of benchmark reform, to use the FCA’s own language:
1. The decision on whether and how the FCA might permit legacy use of GBP and YEN Synthetic LIBOR settings after January 1st, 2022.
2. The question of whether and how the FCA might prohibit new use of overnight, 1m, 3m, 6m and 12m US dollar LIBOR settings after January 1st, 2022.
While we will explore the prohibition of use of US dollar LIBOR settings in a later post, we focus here on the linked questions around whether and how the FCA might permit legacy use of GBP and YEN Synthetic LIBOR settings?
Grounds for confusion?
Since the sweep of LIBOR reforms commenced major global regulators have uniformly urged market participants to deal with legacy LIBOR contracts in two broad ways:
1. amending contractual fallbacks; or
2. conducting active LIBOR-ARR transitions.
For those contracts that might “prove unable to convert or be amended” regulators in major jurisdictions have focussed extensive past-year efforts trying to determine how best to a) define, and b) accommodate post-cessation treatment of “Tough Legacy” contracts.
Exemplifying this, the Bank of England established a Tough Legacy Taskforce within the Bank’s Working Group on Sterling Risk-Free Reference Rates while the UK Parliament passed laws in early 2021 giving the FCA wide powers to deal with this issue. Similar US legislation passed the New York State Assembly in April 2021.
The combination of these various efforts and widespread common use of the descriptor “tough legacy” has not unreasonably led market participants to develop LIBOR-cessation plans on the assumption that the sub-set of products deemed “tough-legacy” would likely be narrowly defined in any jurisdiction. Further, that reliance on a regulatory response for contracts other than those deemed “tough” would be unwise.
Consider the FCA’s language under section 3, The Article 23C legacy use power:
Our proposed decision
3.1 We propose to permit legacy use of these 6 synthetic LIBOR settings in all contracts except cleared derivatives (whether directly or indirectly cleared).
3.2 We do not propose to apply any limitations or conditionality to the above permissions, at least before the end of 2022.
While the CP21/29 is not a foregone conclusion (consult responses are requested by 20th October), LIBOR exposed parties could infer that it hints at a 180-degree turn on the part of the regulator, and we wouldn’t blame them:
§ Far from being narrowly defined, the availability of a Synthetic LIBOR for legacy GBP and YEN contracts will be exceptionally broad.
§ Parties to non-ISDA LIBOR-referencing contracts that have not yet transitioned (in any way) can now consider a third option: doing nothing.
§ Parties that elected to repaper contracts, particularly via common switch provisions, or who have actively transitioned deals already, may feel they were somewhat misled in the lead-in to their decision-making.
These reactions are not unreasonable, but that is not to concede that they’re warranted.
Martialis View
The “proposed decision” outlined in Point 3. CP21/29, should not be read in isolation.
Significant practical constraints to reliance on Synthetic LIBOR remain and market participants should carefully evaluate whether to utilise it, particularly where more robust alternative paths are clearly available.
Synthetic LIBOR could be thought of as a makeshift substitute to robust fallback or active transition, but important considerations, not limited to the following, should be carefully taken into account:
1. The FCA’s preparedness for an all-contract use case is not open ended
While they have the power to compel IBA publication of a Synthetic LIBOR for up to 10 years, the extent of a commitment outlined in CP21/29 is to end-2022, to wit: they do not propose to apply any limitations or conditionality to the above permissions, at least before the end of 2022.
To be specific, under ARTICLE 21(3) BENCHMARKS REGULATION – NOTICE OF FIRST DECISION, of September 29th, the FCA state that: the compulsion period shall be for 12 months starting immediately after the final publication of the 6 LIBOR Versions (GBP and YEN) on 31 December 2021 and before the 6 LIBOR Versions would otherwise cease.
The FCA will regularly assess Synthetic LIBOR (annually is likely) and may discontinue its publication prior to the 10-year maximum allowed.
This should give significant pause for consideration to those who might otherwise accept what presents as an easier path past the end-2021 cessation event.
1. Term-RFR use case limits across derivative markets remain unsettled
While a jurisdictional divide on this question appears to have opened up between the UK and US (and Japan), it’s clear that UK regulators have misgivings over unlimited Term-SONIA use.
For those who may subsequently seek term-rate hedges to replace Synthetic LIBOR in legacy deals, a downstream lack of use-case availability or liquidity should be a consideration.
However, we do note the use of Term SOFR in large syndicated deals in the US is becoming more common.
2. Parties with fixed-rate products
In examples such as the hedged-facilities common across asset and infrastructure-finance, active reliance on Synthetic LIBOR for both facility and hedge (provided it is uncleared) should be carefully considered.
Subject to points 1 and 2 (above) this approach may hold advantages where parties attempt to preserve existing fixed rates, a topic we are particularly familiar with.
3. New products and reference rates
With what appears like a ‘stay on execution’ of GBP and YEN LIBOR the markets will have additional time to develop new products and alternatives which may include term rates. These may be more suitable for some participants.
Firms will need to remain alert to these developments as many end-users have shown a preference for term rates such as Term SOFR and BSBY.
Conclusion
For those who feel they could have avoided transition or repapering costs/disruption, a degree of frustration at the FCA’s poorly telegraphed announcement could be expected. We believe it will be important for participants to better understand this topic, and how it actually adds to choices that need to, like so much in the post-LIBOR finance, be carefully evaluated.
There are insights, then there’s real insight – the value of independent review
2004 was not a year of pandemic, nor of global financial crises, but it was a truly difficult year for a group of financial professionals. In this blog we ask a simple question – could their truly difficult year have been avoided?
Here I look closely at a major trading desk fraud and interview a senior risk executive at the heart of the investigation. One major failing was a lack of effective oversight and particularly some independent review which could have detected the issues well before they detonated.
So what happened?

The 3rd year of the new millennium began with few ominous portents. The Rover lander was settling itself delicately on Mars, a last VW Beetle had rolled off its production line in Puebla, Mexico, and decision-makers in the United States, having chosen to invade Iraq did not appear intent on doubling down on their chase for weapons of destruction, mass or otherwise; financial markets were simply dozing.
Becalmed in the charm of early-year, the S&P 500 had drifted quietly from 1112 and would fail to crack 1200 until December, ten-year US paper opened at 4.25% and would end the year a mere 2 basis-points lower; currency markets snoozed.
Yet, for a relatively small group of Australian financial markets executives 2004 would be a truly defining year.
At 1:53 pm on January 13th the then largest of Australia’s financial services leviathans made a startling market announcement on the Australian Stock Exchange; its risk teams had identified “losses relating to unauthorised trading” and that immediate action had been taken to close out and therefore “minimise any further losses being incurred.” The Bank did venture a little further, curtly confirming that losses were “not expected to exceed $180 million.”
For those whose year the announcement would define the shock of such a short statement must have come as a mixed blessing; the announcement was brief, the loss seemed contained, could there be much more to see and hear on the matter? Would there more to it?
And of course, the answer was yes, a great deal more.
Beyond wild estimate the ultimate cost to the long-proud firm is impossible to calculate, but we know today that it was more than the $180 million posted in that first ASX announcement. It is very hard to account for the costs of a disrupted business and the lost custom that comes when normal offerings are curtailed by regulatory order. Increased capital charges can easily be estimated, but what of distracted management and teams, and what happens when a full-service business can’t offer a full suite of products to customers? Will risk-managing customers wait until you’ve regained composure?
What we can say is that in less than a month the firm in question conceded that the loss was double that conceded in the original announcement. Double. How was that possible? We can’t be sure.
Within six months the firm exchanged its CEO and Chair, sacked the traders deemed responsible, sacked or forced the resignation of eight senior staff, disciplined or moved on 17 others - and carried through on a plan to restructure its board.
What went wrong?
The cheeky answer is lots, but since the prudential regulator devoted undivided attention to the irregular activity and losses it’s perhaps best to let their catalogue of the problems identified stand. In their report on the matter, we find the following:
traders choosing to conceal their true positions;
missed opportunities to detect and close down the irregular activity;
expressions of concern by counterparties at large ignored (by management);
collusive behaviour of the traders involved succeeded in suppressing many of the bank’s early warning signals; and
Line Management turned a blind eye to known risk management concerns.
Which points to too many things for one blog post to mention, but in trying to answer our question (could this have been avoided?) we’ve turned to a former senior risk executive whose intimate familiarity with this story remains very real after seventeen years.
Former Senior risk executive involved in the investigation –
I was involved as a risk executive and dealt with the desk involved. As the APRA review found, I attempted to bring the problem to the attention of senior and executive management, however my concerns were ignored.
Eventually, they were considering moving me away from my position. I was compromised and warned them that without an independent review the desk situation would end disastrously.
Once I stepped away from my duties there was no one of any experience closely monitoring the desk activity.
We asked for his opinion on another simple question – could independent review have made a difference in unveiling the irregular behaviour?
Former Senior risk executive again –
An independent review of that desk at that time may well have allowed genuine discovery.
When management and staff in the depths of any business are blind to fraudulent activities, independent reviewers have the capacity to provide frank and factual advice to senior management and the board.
Independent reviewers bring a fresh set of eyes to issues that are complex in nature and clouded in “noise” and jargon. An independent review dispenses with reporting alignment, routine familiarity and complacency. Independent reviews can highlight deficiencies in reporting requirements and shine a light on those who should have known better.
I truly believe that if this style independent review had been conducted then 2004 would have been a better year.
What’s clear as we look back through the records since this story first emerged is that it’s worth thinking about the right questions and it’s worth thinking about discovery.
Is that business unit, that desk, doing what you expect it to?
Is it aligned to your strategy and complementing the wider business?
Is it conforming to regulator expectations – and the letter of the law?
An independent review can assist with this discovery and help uncover potential issues that may have been overlooked previously.
Supervision of Markets businesses – the independent review

The previous blog on 10 August 2021 looked at some of the measures we use to establish the performance of desks and larger units in market businesses. We use a range of calculations from readily available data to establish the type of desk and therefore the expected performance. In some cases, this aligns well with the expected strategy while at other times it may not!
This blog looks at the ways the performance reviews can assist managers and senior managers.
Effective supervision
The actual performance and sources of revenue are sometimes difficult to uncover using established processes. Put simply, some experienced staff can find very effective ways to disguise the true strategies to create revenue when oversight processes are well understood and any gaps are well known. This can be as benign as internal arbitrage, exploiting a monopoly or a dominant market position. In other cases, the revenue is derived from ‘scope creep’ where the original purpose of the desk has drifted over time to follow other strategies without explicit agreement from managers.
Alternatively, this can result less innocent practices such as fraud. There have been a number of well documented cases where knowledge of internal oversight practices can enable fraudulent activity.
Regulatory supervision such as the Senior Manager Regime (SMR, UK) and Bank Executive Accountability Regime (BEAR, Australia) have increasingly focussed on effective oversight from senior managers who are expected to be informed about the businesses under their control. Unless senior managers take reasonable steps to understand and test businesses under their supervision the regulatory system may find them responsible for any problems.
The challenge for senior managers is how to get information and analysis on their supervised businesses.
Independent review
Independent review is an important method for gathering information by looking at existing processes with new insights. The usual internal reviews are not simply re-used and adapted slightly for the current focus areas of the business. Rather a different approach is typically employed by independent reviewers which can add to the information generated from the regular oversight.
In addition to new ways of looking at existing businesses, an independent firm will not have the restrictions which can be problematic for staff members. Internal oversight can often follow a very predictable path which has been established for some time. Lack of time and a focus for efficiencies can leave businesses using analysis and oversight practices which are out of date and/or without review.
Internal relationships and politics can also make reviews difficult for staff. Who wants to create internal resentment and additional work?
Independent firms are not aligned with internal parties and bring external experiences to the review process which can provide different and unique insights. It is this approach which can greatly assist senior managers demonstrate effective oversight.
Changes over time
Most desks change their trading and sales approach over time to suit changes in market conditions and customers. This is normal and expected. But is the current strategy and performance still within the expectations of senior management?
Our independent performance reviews look at these changes over time. The product mix, customers, trading patterns and key days are all analysed for their impact on revenue and whether they have adjusted to different trading conditions.
For example, the relative use of linear and non-linear products is quite dependent on market volatility and direction: is this reflected in the desk performance? Is there preference for a desk to be ‘long’ or ‘short’? This can be quite indicative of trading strategies and often the use of the balance sheet advantages to augment revenue.
Does being in the office or working remotely matter?
This section of any review is relatively new because pre-COVID, working remotely was very rare for trading and sales staff. But now it is a reality for many businesses with all or part of the desk regularly working from home.
In the highly scrutinised environment of a trading room, oversight is clear and immediate. Despite the increasing use of monitoring software for computers and other devices, it is much easier for staff to use unauthorised information sources to assist in trading and sales. A private phone or tablet is very much ‘off the grid’ and cannot be effectively banned from a home office in the way they can from the trading room.
If there has been a change in trading or sales approach (and this can be very subtle) it can often be detected in the change of performance from in-office to remote location.
This is one test we have recently added to the review based on changing market conditions.
Effective and demonstrable oversight
The focus of the performance review is to provide a view of the past, current and change in desk performance and strategy of desks. The independent review does not replace the internal reviews: rather it is designed to compliment them by adding a different analysis of the same data.
The obligations on senior managers for effective and demonstrable oversight can better met with this combination of internal and periodic external review.
Summary
An independent performance review of a desk or small combination of desks is where the Martialis approach makes most impact.
Many reviews are done across wide businesses and focus on opportunities and risks for those businesses.
We look at the micro level. Close, forensic investigation of desk performance can assist senior managers making strategic decisions on products and customer groups in the context of the whole business while providing clear evidence of effective supervision.
How do Markets desks really perform?
Almost every firm with a trading-desk capability periodically reviews the performance of their sales and trading teams. Typically, this is done using internal 2nd line (risk) and 3rd line (audit) resources at regular intervals following a routine process of checking controls and a range of related processes.
In many cases, underlying performance is not regularly compared with internal and external measures.
We have done some recent work to independently examine the performance of trading and sales teams at firms and arrived at some interesting results. The true source of revenue of certain desks was quite different to that assumed or expected by management, risk and audit.
In some cases, the daily analysis of the sources of revenue was not complete due to limited data sets while in other cases the analysis lacked critical components to highlight inefficient use of balance sheet and/or capital.
In other examples, analysis showed the expected changes to the capital calculations (FRTB and SA-CCR) will also impact the performance of Markets businesses. The efficient use of resources such as capital and balance sheet will be imperative for future profitability of desks and businesses.
Careful, independent analysis of performance is very effective in identifying changes to trading and sales strategies over time. When many firm’s staff are still operating out of the office environment, fully understanding these changes can prevent desks straying from the agreed strategies.

Strategy versus performance
It’s rare to find desks without a reasonably well defined strategy which is agreed with management and risk reflecting the preferred levels of customer engagement, trading performance and risk limits.
But are desks actually following the strategy? We have found some significant deviations from the strategy which can be found in the true performance of the desk. While this may not be a problem for an individual desk, it can lead to duplication and inefficient use of resources across a business.
Statistical analysis
An effective starting point for our performance analysis is a statistical analysis of the trading and sales results over a number of years. Key statistical parameters can be readily calculated from the daily P&L data which can then be aligned to the expected outcomes for desks with similar strategies.
Desks can be broadly classified as ‘flow’, ‘proprietary’ and ‘hybrid’. Although each desk is not uniquely one type only, they typically have strategies which place them predominately in one or the other. Each type has quite distinctive statistical markers which can be tested against the actual desk performance.
In a number of cases, we have found significant differences between the stated strategies of desks and the actual performance. In some cases, reviews have unearthed concerning patterns that lead to important questions and further investigation. This can better inform managers of the daily activity of their teams and help them align their business to their preferred goals.
Runs of positive performance
Long or short runs of positive performance are very insightful when combined with the type of desk and the statistical calculations for that desk. In some cases, long runs of positive P&L are expected while in other cases a more random dispersion of results is typical.
Anomalies in the expected performance runs can show either poor performance and/or the existence of internal or firm advantages. For example, significant balance sheet used to fund certain assets at comparatively cheap rates may be within the strategy of the desk; or it may not. Either way, the true performance might show inefficient or inappropriate use of cheap funding rates.
We have found this measure helps identify aspects of performance that can be compared with the desk strategy and expected performance.
Different time frames of reference
Most performance analysis is done on a monthly and annual basis. Budgets are set and monthly results are often used to identify and adjust expected targets across businesses for revenue, cost and capital.
While this is a perfectly reasonable management approach, we have found looking at performance on a more micro scale can yield significant information to better manage the monthly and annual performance as well as identify areas of improvement. In particular, the daily and weekly P&L data can be used to effectively identify these areas.
Potential misconduct?
While this is rare it still exists. In many of the public cases, ‘post-mortem’, detailed reviews of daily performance compared with the expected performance have shown that preemptive actions could have averted the fraud and saved considerable losses, reputations and remediation costs. We have all seen how modest business units have led to substantial losses far exceeding long-run profitability.
No manager (front office or risk) wants to find fraudulent activity and an independent review can uncover both potential and actual opportunities for unapproved trading that might otherwise remain hidden.
Summary
Martialis has skilled market professionals with significant experience in desk performance-analysis covering most asset classes and types of activity.
Although the emphasis is on improving efficiency though careful analysis to ensure resources are used according to the strategy, we have also found serious concerns about potential and real fraud.
Independence is key. A fresh look at familiar data and some different techniques of analysis can add significantly to the understanding of desk performances and, crucially help management unearth and understand anomalies.
The Potential Wall at Cessation
Is this the way LIBOR ENDS?
As we approach the date when pre-cessation triggers become effective for GBP, JPY and CHF the transition for derivatives subject to the ISDA Fallback Protocol or Supplement may face the impact of hitting a wall where the reference rate changes suddenly.
This has been written about previously at Clarus and by the Murex team and in Risk.net. Then it was a theoretical problem about revaluations and curve construction; now it looks very real! And rather ironically, when this potential issue was first raised, the wall looked like a cliff where there may be a sudden fall in reference rates over the cessation date whereas now it looks more likely there will be a sudden increase in rates.
In this blog I look at the GBP and USD markets and how they are predicting the reference rate changes from LIBOR to the ISDA Fallback Rate on 31st December 2021 and 30th June 2023 respectively.
LIBOR is not necessarily Risk Free Rate plus Spread Adjustment (Fallback Rate)
The ISDA Fallback Rate is the Adjusted Reference Rate plus the Spread Adjustment for the relevant tenor of that period of the trade. Although this is commonly applied in derivatives there is some use in other products such as loans and securities.
The Fallback Rate replaces LIBOR after the cessation date or the effective date of the pre-cessation announcement, in this case after 31 December 2021 for GBP (and other non-USD LIBORs) and 30 June 2023 for remaining USD LIBORs.
Note that the Fallback Rate is a replacement and is not required to equal LIBOR. The LIBOR on the last day will behave as LIBOR always has and be subject to issues of liquidity and credit which may not equal the 5-year median in the ISDA Spread Adjustment.

GBP on 31 December 2021
The table on the right is where the markets are at this time and where they are predicting LIBOR and the Fallback Rate may be on 31 December 2021.
The yellow highlights show the potential difference in the reference rate applied to contracts. The current differences are around 3 bps (1-month), 9 bps (3-month) and 23 bps (6-month).
If we look forward to the market prediction on 31 December 2021, the the differences are smaller but still there, respectively approximately -1 bps (1-month), 6 bps (3-month) and 19 bps (6-month). This indicates contracts with a cessation date for GBP LIBOR on 31 December 2021 could see a jump in rate on 3 January 2022.
But a word of caution, the Fallback Rate is only known at the end of the relevant period and could differ substantially from the market predicted rate.

Note: the forward OIS and LIBOR rates for GBP and USD are derived from futures prices. In particular, the USD 1 and 3-month LIBOR rates may be too low dues to ‘turn of year’ effects.
USD on 30 June 2023
A similar outcome emerges in the USD LIBOR which is destined for effective cessation on 30 June 2023. Again the yellow highlights show the differences now on those predicted on 30 June 2023.
The 1-month difference is relatively minor however there are more substantial predicted differences in the 3 and 6-month tenors.

Potential impacts
Costs for borrowers and returns for investors
the sudden change in rate will give a potentially large difference between the reference rate on 31 December 2021 and 3 January 2022
small mismatches in reset dates between exposure and hedge may create large accrual differences
Modelling the gap
such a discontinuous change in rates is notoriously difficult to model
many systems will attempt to create a smooth curve around the dates which can impact revaluations on many days either side of the change (see the Murex article)
Differences in outcomes
LIBOR fixes at the start of the period while Fallback Rate has daily fixes during the period
the actual outcome may differ from the projected outcome at the start of the period leading to accrual differences
Summary
I end this blog very simply: LIBOR is not the ISDA Fallback Rate and it may evolve differently to the market expectations.
Changes to liquidity and credit spreads will impact LIBOR and the final outcome may not be consistent with the 5-year median approach in the ISDA Spread Adjustment and therefore the Fallback Rate.
So monitor the markets and be prepared for a potential surprise on cessation dates!

And finally a reminder of how much the Spread Adjustment can vary under extreme conditions. This is the GBP 3-month for the year up to June 2020 through the COVID-19 time.
The 5-year median is 0.1193% bit the spread went to approximately 0.80% before falling to its present level.
Source: Bloomberg
FCA Consultation on Synthetic LIBOR - CP21/19 - June 2021
The demise of LIBOR has been well documented since July 2017 when Andrew Bailey, CEO of the Financial Conduct Authority (FCA) in the UK first announced possible cessation by the end of 2021. This set in train a number of actions by regulators and central banks globally to prepare for this momentous event.
On 5th March 2021, the FCA has made a pre-cessation announcement which will cause certain contracts to move to the fallbacks in the future. Specifically, the FCA announced the future loss of representativeness of certain LIBORs. The critical dates are 31st December 2021 for most LIBORs and 30th June 2023 for remaining USD LIBOR. The following diagram shows the timeline.

This announcement constitutes a pre-cessation trigger which is quite different to a permanent cessation of LIBOR. Only contacts with a pre-cessation clause will revert to fallbacks while those without the clause will continue referring to LIBOR (if it exists) or use their existing fallbacks.
The FCA intends to direct the current LIBOR administrator (using powers under Article 23D(2)) to continue to publish some LIBORs beyond December 2021 using a revised calculation methodology. This is often referred to as ‘synthetic LIBOR’. Contracts without the pre-cessation trigger look very likely to refer to synthetic LIBOR after December 2021.
Consultation CP21/19 was released in June 2021 and invites responses on the future of GBP and JPY synthetic LIBOR.
What is the FCA proposing?
The FCA are proposing a number of changes to GBP and JPY LIBORs. I will look at two of these in this blog:
1) The choice of rate; and
2) The choice of credit spread.
There are many other proposals in the consultation but these two have the potential to have significant impacts on anyone who remains on GBP or JPY LIBOR after December 2021 which will then be referring to synthetic LIBOR.
The choice of rate
The underlying rates are Term SONIA (provided by IBA) and TORF (provided by QBS). Both are forward-looking rates based on OIS quotes in the GBP and JPY markets each day.
Term SONIA is calculated from GBP (SONIA) OIS markets while TORF (Tokyo Risk Free Rate) is derived from the JPY (TONA) OIS market.
The FCA has already selected these rates and the consultation does not invite further discussion on this point.
The choice of credit spread
The FCA has made a recommendation as per the Table 1 below. Their preference is to align the credit spread with the ISDA spread adjustment published by Bloomberg (highlighted in bold).
However, the actual 5-year LIBOR - OIS credit spread (I added the the red box to highlight this) is quite different to the ISDA spread particularly for longer tenors. The choice of credit spread will have impacts on all users of synthetic LIBOR and needs to be carefully considered for a firm’s exposure and valuation.
While it is tempting to align the credit spread with ISDA (i.e. derivatives) this is not the actual, calculated 5 -year median of the LIBOR - OIS spread. By using ISDA, the implication is that the compounded OIS and the Term OIS are identical (i.e. OIS average settlement is zero over the 5 years) which is clearly not the case as seen in Table 1.
The fact that OIS trades do not settle at zero (averaged over 5 years) gives rise to this difference.

The choice of credit spread will have impacts on all users of syntheic LIBOR. Let’s look at a few example calculations.
Example calculations for GBP Synthetic LIBOR
The following table shows the impact for a GBP borrower using GBP 1 million and 1 billion notional.
Clearly, for a borrower using the ISDA spread is disadvantageous compared with the actual LIBOR -OIS spread. However, this analysis is based on the Term SONIA and the compounded daily SONIA being equivalent rates at the end of each period. This is unlikely and needs to be appreciated in the calculations.
Also note that the calculations are symmetrically opposite for the investors: there could be an advantage for these users.

Even with the caveats related to Term SONIA and compounded daily SONIA, there is a real risk of a transfer of value from borrowers to investors using the ISDA spread. Over the 5 years of calculation, the actual LIBOR - OIS credit spread could be regarded as a more appropriate measure of the adjustment required and therefore able to minimise the value transfer.
Many portfolios are much greater than 1 million or 1 billion notional so the final impact could be very substantial.
A short comment on revaluations
Another complication is the impact on revaluations which arises from the choice of credit spread. Forward rates are calculated from the relevant OIS curves which means Term SONIA and compounded, daily SONIA are identical (also for TORF and TONA).
If the ISDA and synthetic LIBOR credit spreads are different (i.e. LIBOR - OIS ) then the present value of trades linked to synthetic LIBOR and derivatives will be different if valued on the same curve. This would create a revaluation difference if the same curves are used for derivative and synthetic LIBOR valuations. Users should take care to separate the trades and assign the correct curve to each.
Summary
The FCA consultation will have impacts on users of synthetic LIBOR. There may be value transfer based on the choice of credit spread which could be substantial for some users.
I encourage everyone to look carefully at the proposals and analyse the potential impacts on your portfolios which may refer to synthetic LIBOR after December 2021.
Martialis has substantial experience in these calculations. We can assist you in this analysis and provide an independent review of your options.
New Developments in USD Reference Rates

The rise of new, credit sensitive benchmarks in USD presents users with a range of options which may better suit their purposes. As markets begin to move away from USD LIBOR there has been some resistance to using a single reference rate such as SOFR. The pricing challenges of switching from the familiar processes of LIBOR to a new rate with little (or no) credit and liquidity margin as well as the operational challenges of using a rate like SOFR (where the final reference is only known at the end of the relevant period) has presented many users with a good reason to delay transitioning away from LIBOR. The SOFR alternatives actually operate similarly to LIBOR and help solve many of the operational issues. They include:
Reference Rate Administrator Description (all forward-looking term rates)
Term SOFR CME Calculated from CME SOFR futures and possibly OIS, no credit spread
BSBY Bloomberg Calculated from bank funding in unsecured markets
CRITS/CRITR IHS Markit Calculated from USD CD and CP market (‘S’ is Spread and ‘R’ is Rate)
IBYI ICE Similar to BSBY and has been puiblished for over 2 years
AXI SOFR Academy Calculated from credit spreads out to 5 yeears which is then scaled to 1, 3 and 6 month
While all these alternatives have a term structure and most have a credit spread (except Term SOFR) they are all subtly different and some may be more appropriate for certain uses rather than others.
The advantage of all is that they are operationally similar to LIBOR (set at the start of the relevant period) and have a term structure. This makes them all easier to implement in current systems and processes and allows many users access to LIBOR replacements.
The markets will decide which reference rates dominate but these are significant contributors to LIBOR transition. Risk.net has a great article on the alternatives here.
Martialis is very experienced in managing LIBOR transition for many clients. These new reference rates may be appropriate for your needs and we can assist in assessing the options.