
As part of some recent work, I looked at the longer-term trends in the populations for Japan and Australia with a particular focus on the demographics and infrastructure.
While this is outside my usual work, it highlighted several interesting possibilities for the future of infrastructure and the future value of those assets.
In many cases, investors are looking at stable, long-term investments which include infrastructure and the returns are often dependent on the use of those assets to generate stable income.
In turn, the assets depend on who uses them to generate those returns.
Why Japan and Australia as examples?
Japan had a rapidly expanding population from 1950 until 1990. Immigration was very limited, so the demographics were largely dependent on existing population, fertility and mortality rates but was not impacted by external contributions. Japan also has easily accessible records of key, accurate and regular statistics used as inputs to the model making the modelling process much easier.
Australia’s population trajectory is quite different to Japan since 1950. Australia has had a long-standing immigration policy which has seen significant growth in the population which inevitably affected the demographics.
The two counties are similar in having relevant statistics which are readily available, accurate and regularly updated.
The methodology and assumptions
The methodology was not ‘fitted’ to the results; it was based on only 2 assumptions:
working ages were 20 – 70 years; and
immigration followed the existing age demographics (i.e., Australian immigration was the same as the local age spreads).
The methodology simply used these inputs per age group (i.e., each 10-year group):
percentage of the population per age group in 1950;
mortality rates at each age group each 10 years;
fertility (number of children per female) each 10 years;
average age of mothers at births each 10 years; and
percentage immigration relative to the current population and age percentages.
All the inputs were derived from official statistics as published in Japan and Australia.
The results
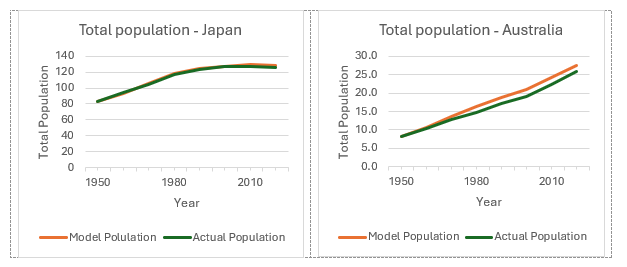
My model shows very close tracking of the population statistics in both counties. The two tables below show the actual, recorded populations, the results of the model and the percentage difference.
Population-actual and model 1950 - 2020
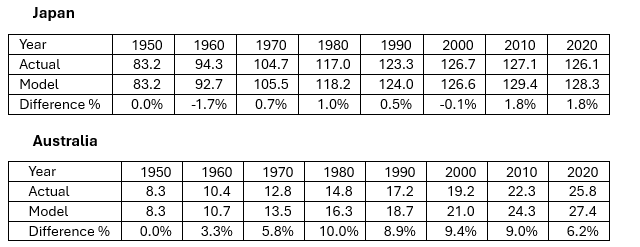
The model manages to track the populations within 2% in Japan and 10% in Australia. I note the Australia population statistics are ‘who is in the country now’ which may over or under state the permanent population and make the comparison somewhat less accurate.
I have made only 2 assumptions (above) and the model was not fitted (i.e., I used the raw inputs for both Japan and Australia). The raw inputs of population and age distribution were used from a starting point of 1950 for 70 years without a re-balance.
In both cases, the model tracks the population within error which I estimate at +/- 10%.
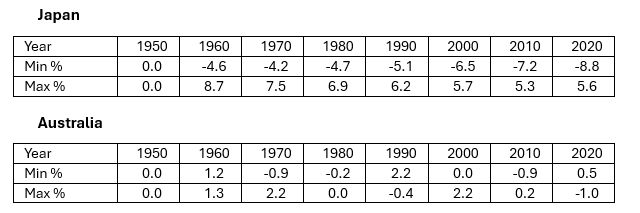
Population per age group 1950 - 2020
I also tested the model for the percentage of the population at each age group. The model percentage was compared with the actual percentage in each age group.
Again, the starting point was the reported percentage in 1950, and I let the model run for 70 years. In the following tables, the minimum and maximum are the extreme differences between the actual populations at each age group and the modelled populations.
Japan and Australia are following 2 different trajectories in total population.
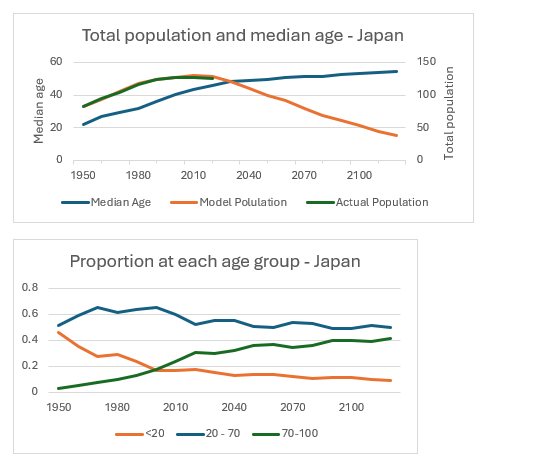
Japan, with no appreciable immigration and a low fertility rate, trends gradually toward 38 million from the current levels around 126 million.
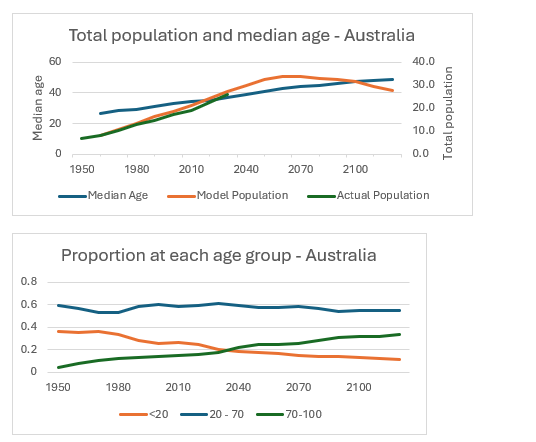
Australia delays the decline due to immigration. I have assumed immigration to Australia is steady at 8% until 2040 then declining to 5% for the remainder of the model period. Population peaks around 2060 but declines gradually thereafter.
Demographics over 170 years
As the model population decreases, the median age increases. This agrees well with popular commentary.
In Japan, the proportion at working age (I assume 20 – 70 years) remains around 50% of the population. The proportion of younger people (<20 years) decreases from 50% to 17%, offset by older people (70 + years), increasing from 3% to 40%.
In Australia, the situation is similar to Japan. The proportion at working age remains around 50% - 60% of the population. The proportion of younger people decreases from 50% to 21%, offset by older people (70 + years), increasing from 4% to 30%.
Summary of results
The model shows some very interesting results particularly for planning and infrastructure.
Total populations are dependent on immigration with the current fertility rates in Japan and Australia. The lower the immigration (Japan) the population decline is significant.
The proportion of working age people remains around 50% for the next 100 years.
The proportion of people < 20 years falls in both countries.
The proportion of people > 70 years increases in both countries.
Implications of the model
The model predicts the proportion of working people remains relatively constant in both countries. This suggests there will continue to be sufficient people in the workforce to provide services for the ~ 50% not working (younger or older).
But, in both countries, the non-working population has a very significant change in demography from younger to older ages. This has clear implications for the services and infrastructure needed to support the population as well as the skills in the working population to provide the services.
As the total number of people falls (soon in Japan and eventually in Australia), the infrastructure will need to be adjusted to suit the changes in use, both the size and nature of the infrastructure.
Is the transport infrastructure suited for the demographic changes?
The number of people using roads, rail, ground and air transport decreases. With infrastructure designed to last for many years, how will the changes impact the planning and investment decisions?
Are the public service systems and products adapted for the changes?
The change to an older population will likely present ongoing challenges for the public services and funding directed to the population.
What impact will technology have on infrastructure needs?
Technology will be a critical input to infrastructure and services.
What happens if robots replace many of the service roles needed for older people? Food and personal care may be handled by a machine to remove the need for manual labour.
Transport technology is changing quickly. For example, self-driving trains, cars, trucks and taxis can replace people and, arguably, improve transport safety. What would be the road requirement if all road users had self-drive and vehicle-to-vehicle communications to avoid congestion and allow for smaller, safer travelling gaps between vehicles. The result could be fewer roads and lanes to accommodate the same traffic.
Investment decisions
The demographics show that a decision to invest in more old age care and less childcare is a real issue for Japan now and Australia in the future.
Other infrastructure like, power, water and road networks will also have to be sized correctly to avoid over (or under) investment including location and population density.